dev-guides
Linux Kernel Debugging
This guide was written by Andy Cheng and Jeremy Carin in the Spring 2023 semester of OS.
Debugging the kernel can be painful. This is perhaps natural, since one of the primary purposes of the kernel is to provide a safe and isolated environment for userspace programs. There is no such layer below the kernel to provide safety to the kernel itself.
This guide provides tools and strategies for debugging, but is not meant to an exhaustive guide of all bugs you may encounter. We will focus on how to approach these categories of bugs:
- Kernel OOPS: a bug triggered when the kernel encounters a specific error.
These errors can occur due to various reasons, such as an invalid memory
access. An oops can be triggered by calls to
BUG()orpanic(), which are placed in error cases to provide debugging information. The severity of the error determines whether or not the kernel crashes (panics). - Kernel lockup: a bug that causes the kernel to be unresponsive or hang. This is often due to deadlocking.
Kernel Configurations
To start, the kernel provides a couple of useful configuration options that we recommend you enable to help you with your debugging. Note that most of the options will likely increase the amount of memory and CPU time the kernel uses, so you might want to allocate more CPUs or more memory to your VM as needed.
To enable these configurations, we recommend you use the kernel’s provided scripts like so:
$ cd <path/to/linux>
$ scripts/config --enable <config name>
Basic Debugging Configurations:
CONFIG_DEBUG_KERNEL- enables kernel debugging config optionsCONFIG_DEBUG_INFO- compile the kernel with-gflags so that the kernel has information about function names and other symbolsCONFIG_KALLSYMS- keep theSystem.mapfile, which relates addresses to function names, always loaded in memory in case the kernel crashes
Memory Debugging Configurations:
CONFIG_KASAN- detects use-after-free bugs, buffer overflows and other types of memory issues in the kernelCONFIG_STACK_VALIDATION- helps detect stack overflows and other issues by validating the stack pointer on function returnCONFIG_DEBUG_SLAB- enables debugging of kernel memory allocation with the slab allocator
Lock Debugging Configurations:
CONFIG_DEBUG_SPINLOCK- catches basic mistakes with using spinlocks, like unlocking a lock that hasn’t been lockedCONFIG_DEBUG_SPINLOCK_SLEEP- catches trying to sleep (or calling something that could try to sleep) while holding a lockCONFIG_PROVE_LOCKING- keeps track of what functions grab certain spinlocks, mutexes, and semaphoresCONFIG_DEBUG_LOCKDEP- checks for circular lock dependencies (deadlocks), and dumps a warning when it finds one- Note that calling
printkwhile holding a lock can trigger this warning, sinceprintkgrabs a lock itself
- Note that calling
ftrace Configurations:
CONFIG_FUNCTION_TRACERCONFIG_FUNCTION_GRAPH_TRACERCONFIG_STACK_TRACERCONFIG_DYNAMIC_FTRACE
There are plenty of other configuration options not listed here that you might
find useful. For a more comprehensive list, you can navigate to the Kernel
hacking tab after running:
$ make menuconfig
printk
In a userspace program, the simplest and oftentimes most effective debugging
tool is to strategically insert print statements in branching code paths to see
how your program runs. However, in the kernel, you cannot use the C printf()
function because it requires a running userspace process to interact with the
console. Instead, you can use the printk() function to print messages to the
kernel log. The kernel log is a ring buffer where the kernel stores log
messages.
You can use the printk() function to print messages at different log levels
such as KERN_WARNING, KERN_INFO, and KERN_DEBUG like so:
printk(KERN_INFO "hello\n")
The kernel provides macros such as pr_info() and pr_warn() that serve the
same purpose. They have the additional benefit of allowing you to define a
pr_fmt() macro, which can be used to generate a unified format for all
pr_*() macros. A common use is to prefix all pr_*() messages in a
compilation unit with a common string. For example, to prepend all messages with
a module name:
#define pr_fmt(fmt) KBUILD_MODNAME ": " fmt
To view the kernel log, you can use the dmesg command. By default, it shows
the entire kernel log, but you can use filters to see only messages at a
specific log level or from a specific driver.
Serial console
Sometimes, you might not be able to see your debug messages in the kernel log buffer before the system crashes. Instead of printing to the kernel log buffer, you can redirect your messages to a file on your host machine. Here are the steps:
x86 Machines
- Shut down your virtual machine
- In your virtual machine’s settings:
Add Device- Choose
Serial Port - Choose a file path on your host machine to store the log
- Boot your virtual machine. Under
Advanced Options for GNU/Linux:- Navigate to the kernel you want to boot to, but do not press
Enter - Press
eto edit the boot parameters - Look for the line that specifies the boot arguments, with the format
linux /boot/vmlinuz-<kernel-name> root = ... - Replace the
quietparameter withconsole=ttyS1orconsole=ttyS0(ifttyS1doesn’t work). HitEnterto save your changes - Press
Ctrl+Xto boot into your kernel
- Navigate to the kernel you want to boot to, but do not press
arm64 Machines
- Shut down your virtual machine
- In your virtual machine’s settings:
Add Device- Choose
Serial Port - Choose a file path on your host machine to store the log
- On your host machine, navigate to the directory where your virtual machine’s
files are. This will likely be at
/Users/<user>/Virtual Machines.cdinto your VM’s directory. - Inside the virtual machine’s directory, find the file called
<vm-name>.vmx. Open this file with a text editor- Before making modifications to this file, it’s a good idea to save a copy of this file just in case
- Find the line in the form
serial<N>.fileName = "<output-filename>" - Below this line, insert the line
serial<N>.startConnected = "TRUE"
- Boot your virtual machine. Under
Advanced Options for GNU/Linux:- Navigate to the kernel you want to boot to, but do not press
Enter - Press
eto edit the boot parameters. - Look for the line that specifies the boot arguments, with the format
linux /boot/vmlinuz-<kernel-name> root = ... - Replace the
quietparameter withconsole=ttyS<N>, where<N>is the serial number found in the.vmxfile. HitEnterto save your changes - Press
Ctrl+Xto boot into your kernel
- Navigate to the kernel you want to boot to, but do not press
All your debug messages and kernel errors will be redirected to the file path you specified earlier, even when your kernel freezes and/or panics.
Note you will have to replace this quiet parameter on each boot of your
virtual machine.
Reading an OOPS! Report
So something you wrote, either in a module or in the kernel itself, has caused an OOPS. Don’t reset your computer just yet - there’s a lot of useful information that can be found in one of these reports.
Let’s look at an example OOPS message generated when trying to load a very basic
kernel module, ded.ko. If you would like to follow along, we’ve provided the
source for this module here:
[  228.969133] ------------[ cut here ]------------
[  228.969990] kernel BUG at /home/andyc/OS-dev/dev-guides/docs/files/debugging-examples/basic-oops/ded.c:9!
[  228.971510] invalid opcode: 0000 [#1] SMP PTI
[  228.972220] CPU: 0 PID: 1643 Comm: insmod Tainted: G           OE     5.10.158-debugger #5
[  228.973489] Hardware name: VMware, Inc. VMware Virtual Platform/440BX Desktop Reference Platform, BIOS 6.00 11/12/2020
[  228.975198] RIP: 0010:grave+0x5/0x10 [ded]
[  228.975868] Code: Unable to access opcode bytes at RIP 0xffffffffc0a43fdb.
[  228.976908] RSP: 0018:ffff9954816e3df0 EFLAGS: 00010286
[  228.977706] RAX: 0000000000000001 RBX: 0000000000000000 RCX: 0000000000000000
[  228.978988] RDX: 0000000000000cc0 RSI: ffffffffab368153 RDI: ffffffffc0a44010
[  228.980605] RBP: ffffffffc0a44010 R08: 0000000000000010 R09: ffff8d9f4bee3200
[  228.981882] R10: ffff8d9f451cf180 R11: 0000000000000000 R12: ffff8d9f4bee3200
[  228.982968] R13: ffff9954816e3e90 R14: 0000000000000003 R15: 0000000000000000
[  228.984168] FS:  00007ff357f40540(0000) GS:ffff8d9f77e00000(0000) knlGS:0000000000000000
[  228.985464] CS:  0010 DS: 0000 ES: 0000 CR0: 0000000080050033
[  228.986410] CR2: ffffffffc0a43fdb CR3: 00000001058c2003 CR4: 0000000000370ef0
[  228.987493] Call Trace:
[  228.987908]  ded_init+0xa/0xa [ded]
[  228.988448]  do_one_initcall+0x58/0x2d0
[  228.989063]  ? rcu_read_lock_sched_held+0x12/0x80
[  228.989868]  ? kmem_cache_alloc_trace+0x25b/0x2e0
[  228.990601]  do_init_module+0x4c/0x250
[  228.991177]  __do_sys_finit_module+0xb1/0x120
[  228.991910]  do_syscall_64+0x30/0x80
[  228.992466]  entry_SYSCALL_64_after_hwframe+0x61/0xc6
[  228.993302] RIP: 0033:0x7ff35805f2e9
[  228.994076] Code: 00 c3 66 2e 0f 1f 84 00 00 00 00 00 0f 1f 44 00 00 48 89 f8 48 89 f7 48 89 d6 48 89 ca 4d 89 c2 4d 89 c8 4c 8b 4c 24 08 0f 05 <48> 3d 01 f0 ff ff 73 01 c3 48 8b 0d 77 8b 0d 00 f7 d8 64 89 01 48
[  228.998197] RSP: 002b:00007fff3de2ead8 EFLAGS: 00000246 ORIG_RAX: 0000000000000139
[  228.999355] RAX: ffffffffffffffda RBX: 000055ca085f67c0 RCX: 00007ff35805f2e9
[  229.000450] RDX: 0000000000000000 RSI: 000055ca07e8b260 RDI: 0000000000000003
[  229.001556] RBP: 0000000000000000 R08: 0000000000000000 R09: 00007ff35813b960
[  229.002669] R10: 0000000000000003 R11: 0000000000000246 R12: 000055ca07e8b260
[  229.003795] R13: 0000000000000000 R14: 000055ca085f6760 R15: 0000000000000000
[  229.005028] Modules linked in: ded(OE+) jail(OE) rfkill(E) intel_rapl_msr(E) intel_rapl_common(E) intel_pmc_core(E) crc32_pclmul(E) snd_ens1371(E) ghash_clmulni_intel(E) snd_ac97_codec(E) ac97_bus(E) snd_pcm(E) snd_timer(E) snd_rawmidi(E) aesni_intel(E) glue_helper(E) libaes(E) crypto_simd(E) vmw_balloon(E) cryptd(E) snd(E) evdev(E) joydev(E) soundcore(E) serio_raw(E) pcspkr(E) sg(E) gameport(E) vsock_loopback(E) vmw_vsock_virtio_transport_common(E) vmw_vsock_vmci_transport(E) vsock(E) vmw_vmci(E) button(E) ac(E) binfmt_misc(E) msr(E) parport_pc(E) ppdev(E) lp(E) parport(E) fuse(E) configfs(E) ip_tables(E) x_tables(E) autofs4(E) ext4(E) crc32c_generic(E) crc16(E) mbcache(E) jbd2(E) hid_generic(E) sd_mod(E) t10_pi(E) crc_t10dif(E) crct10dif_generic(E) usbhid(E) hid(E) vmwgfx(E) ata_generic(E) drm_kms_helper(E) uhci_hcd(E) cec(E) ata_piix(E) mptspi(E) libata(E) scsi_transport_spi(E) ttm(E) ehci_pci(E) mptscsih(E) ehci_hcd(E) drm(E) mptbase(E) usbcore(E) scsi_mod(E) psmouse(E) e1000(E)
[  229.005080]  crct10dif_pclmul(E) crct10dif_common(E) crc32c_intel(E) i2c_piix4(E) usb_common(E)
[  229.023029] ---[ end trace 599b7e93901a8518 ]---
There is a lot of information here, much of which requires knowledge of the underlying architecture of your machine. Let’s break down some of the generally useful lines, though.
[ 228.969990] kernel BUG at /home/andyc/OS-dev/dev-guides/docs/files/debugging-examples/basic-oops/ded.c:9!
This line is a general overview of the issue. In this case, we caused the kernel
to report an OOPS using a very specific instruction (BUG), so we actually get
the exact location the kernel broke (line 9 of basic-oops/ded.c). Most of the
time, this first line will just give a small description of why the kernel
failed.
[ 228.972220] CPU: 0 PID: 1643 Comm: insmod Tainted: G OE 5.10.158-debugger #5
This line describes exactly what task caused the issue. From this line, we can
see that the kernel BUG occurred on CPU 0 while running PID 1643. We further
see that the program running was called insmod, and the kernel name was
5.10.158-debugger.
[ 228.975198] RIP: 0010:grave+0x5/0x10 [ded]
RIP refers to the current instruction pointer when the OOPS was generated (on
arm64, this register will be called pc). This is probably the most useful
line of the OOPS, since it shows exactly what function we were running when the
BUG occurred, in this case grave. The [ded] at the end of the line indicates
that this instruction was code from the ded module. The +0x5 in this line
represents the offset of the current instruction from the start of grave, and
the 0x10 represents the total length of the grave function. This can give us
a rough idea of around where in the function the OOPS occurred (You can actually
find the exact line this address corresponds to with addr2line).
Taking all of this into account, we know that the BUG occurred somewhere
around the middle of grave, which is a function from the ded module. Looking
at the source code of grave affirms this:
void grave(void)
{
	BUG();
}
As we can see, the BUG instruction quite literally is in the middle of the
grave function (in fact, it’s the only thing in the grave function), just
like the RIP indicated.
[  228.987493] Call Trace:
[  228.987908]  ded_init+0xa/0xa [ded]
[  228.988448]  do_one_initcall+0x58/0x2d0
[  228.989063]  ? rcu_read_lock_sched_held+0x12/0x80
[  228.989868]  ? kmem_cache_alloc_trace+0x25b/0x2e0
[  228.990601]  do_init_module+0x4c/0x250
[  228.991177]  __do_sys_finit_module+0xb1/0x120
[  228.991910]  do_syscall_64+0x30/0x80
[  228.992466]  entry_SYSCALL_64_after_hwframe+0x61/0xc6
Lastly, this is the call trace of the last few functions that were called prior
to the OOPS. A ? at the beginning of a line means that the kernel is not
certain that the given line is accurate. From this trace, we can see that, prior
to running grave, we call ded_init. Further down, we can see that this
entire chain was caused by do_init_module, reaffirming that loading the ded
module was what caused this BUG.
Example - NULL Pointer OOPS
A vast majority of the time, the kernel BUGs you will encounter will not be from
the kernel calling the BUG instruction directly. Below is the OOPS message
that we get from a more obscure module, naur:
[  448.759743] BUG: kernel NULL pointer dereference, address: 0000000000000010
[  448.761276] #PF: supervisor read access in kernel mode
[  448.762306] #PF: error_code(0x0000) - not-present page
[  448.763391] PGD 0 P4D 0
[  448.763950] Oops: 0000 [#2] SMP PTI
[  448.764659] CPU: 1 PID: 6986 Comm: insmod Tainted: G      D    OE     5.10.158-debugger #5
[  448.766430] Hardware name: VMware, Inc. VMware Virtual Platform/440BX Desktop Reference Platform, BIOS 6.00 11/12/2020
[  448.768832] RIP: 0010:naur_init+0x20/0x30 [naur]
[  448.769790] Code: Unable to access opcode bytes at RIP 0xffffffffc0a3dff6.
[  448.771170] RSP: 0018:ffff995483f0fdf8 EFLAGS: 00010292
[  448.772248] RAX: 0000000000000000 RBX: 0000000000000000 RCX: 0000000000000000
[  448.773725] RDX: ffffffffab2ba6c5 RSI: ffffffffab2ba740 RDI: ffffffffc0a3f048
[  448.775243] RBP: ffffffffc0a3e000 R08: 0000000000000000 R09: 0000000000000000
[  448.776808] R10: 0000000000000000 R11: 0000000000000000 R12: ffff8d9f530fa320
[  448.778245] R13: ffff995483f0fe90 R14: 0000000000000003 R15: 0000000000000000
[  448.779684] FS:  00007f32939c0540(0000) GS:ffff8d9f77e80000(0000) knlGS:0000000000000000
[  448.781307] CS:  0010 DS: 0000 ES: 0000 CR0: 0000000080050033
[  448.782507] CR2: ffffffffc0a3dff6 CR3: 00000001063ec004 CR4: 0000000000370ee0
[  448.784164] Call Trace:
[  448.784890]  do_one_initcall+0x58/0x2d0
[  448.786055]  ? rcu_read_lock_sched_held+0x12/0x80
[  448.787237]  ? kmem_cache_alloc_trace+0x25b/0x2e0
[  448.788270]  do_init_module+0x4c/0x250
[  448.789077]  __do_sys_finit_module+0xb1/0x120
[  448.790046]  do_syscall_64+0x30/0x80
[  448.790852]  entry_SYSCALL_64_after_hwframe+0x61/0xc6
[  448.791933] RIP: 0033:0x7f3293adf2e9
[  448.792683] Code: 00 c3 66 2e 0f 1f 84 00 00 00 00 00 0f 1f 44 00 00 48 89 f8 48 89 f7 48 89 d6 48 89 ca 4d 89 c2 4d 89 c8 4c 8b 4c 24 08 0f 05 <48> 3d 01 f0 ff ff 73 01 c3 48 8b 0d 77 8b 0d 00 f7 d8 64 89 01 48
[  448.796779] RSP: 002b:00007fff05d43188 EFLAGS: 00000246 ORIG_RAX: 0000000000000139
[  448.798728] RAX: ffffffffffffffda RBX: 000055db43c9b7c0 RCX: 00007f3293adf2e9
[  448.800574] RDX: 0000000000000000 RSI: 000055db42236260 RDI: 0000000000000003
[  448.802541] RBP: 0000000000000000 R08: 0000000000000000 R09: 00007f3293bbb960
[  448.804437] R10: 0000000000000003 R11: 0000000000000246 R12: 000055db42236260
[  448.806449] R13: 0000000000000000 R14: 000055db43c9b760 R15: 0000000000000000
[  448.808523] Modules linked in: naur(OE+) ded(OE+) jail(OE) rfkill(E) intel_rapl_msr(E) intel_rapl_common(E) intel_pmc_core(E) crc32_pclmul(E) snd_ens1371(E) ghash_clmulni_intel(E) snd_ac97_codec(E) ac97_bus(E) snd_pcm(E) snd_timer(E) snd_rawmidi(E) aesni_intel(E) glue_helper(E) libaes(E) crypto_simd(E) vmw_balloon(E) cryptd(E) snd(E) evdev(E) joydev(E) soundcore(E) serio_raw(E) pcspkr(E) sg(E) gameport(E) vsock_loopback(E) vmw_vsock_virtio_transport_common(E) vmw_vsock_vmci_transport(E) vsock(E) vmw_vmci(E) button(E) ac(E) binfmt_misc(E) msr(E) parport_pc(E) ppdev(E) lp(E) parport(E) fuse(E) configfs(E) ip_tables(E) x_tables(E) autofs4(E) ext4(E) crc32c_generic(E) crc16(E) mbcache(E) jbd2(E) hid_generic(E) sd_mod(E) t10_pi(E) crc_t10dif(E) crct10dif_generic(E) usbhid(E) hid(E) vmwgfx(E) ata_generic(E) drm_kms_helper(E) uhci_hcd(E) cec(E) ata_piix(E) mptspi(E) libata(E) scsi_transport_spi(E) ttm(E) ehci_pci(E) mptscsih(E) ehci_hcd(E) drm(E) mptbase(E) usbcore(E) scsi_mod(E) psmouse(E)
[  448.808614]  e1000(E) crct10dif_pclmul(E) crct10dif_common(E) crc32c_intel(E) i2c_piix4(E) usb_common(E)
[  448.833358] CR2: 0000000000000010
[  448.834172] ---[ end trace 599b7e93901a8519 ]---
Let’s look at some of the same key lines of the OOPS as we did last time.
[ 448.759743] BUG: kernel NULL pointer dereference, address: 0000000000000010
This time, the BUG occurred from a NULL pointer dereference. Specifically, the
kernel failed trying to dereference address 0x0000000000000010. This might
sound odd, since a NULL pointer always just has a value of 0x0. What this
means is that we likely have a struct pointer that is NULL, and we are trying
to access some element in the struct. This element would not be present at
address 0x0, but rather some offset above address 0x0 (in this case, this
offset is 0x10). When analyzing our code, we therefore should be on the
lookout for any uses of the -> operator.
[ 448.768832] RIP: 0010:naur_init+0x20/0x30 [naur]
This time, it looks like the BUG occurred roughly 2/3 down the naur_init
function of the naur module. Let’s look at the source code for naur_init:
int naur_init(void)
{
	struct pid *pid_struct = find_get_pid(-1);
	struct task_struct *mytask = get_pid_task(pid_struct, PIDTYPE_PID);
	/* Fail to error check get_task_pid */
	pr_info("mytask: %ld\n", mytask->state);

	return 0;
}
So given what we’ve found, we can hypothesize that the issue is with our
pr_info call. Specifically, we likely have a NULL pointer dereference at
mytask->state, meaning mytask was NULL when we expected it to point to a
real task_struct. We conclude that we forgot to check whether mytask was
NULL before using it!
Example - Deadlock Report
One of the most annoying issues that can occur in the kernel is deadlock. Since
the kernel disables preemption while holding a spin_lock, there is a high
chance that a circular dependency can completely freeze a machine in the event
of a deadlock. To address this, CONFIG_LOCKDEP provides helpful warnings
whenever it detects an unsafe locking condition.
Below is an example warning that LOCKDEP will generate when trying to load
sad.ko:
[  121.494481] sad: loading out-of-tree module taints kernel.
[  121.497040] this will be sad
[  121.497570] wow we have the lock
[  121.498102]
[  121.498344] ============================================
[  121.499148] WARNING: possible recursive locking detected
[  121.499966] 5.10.158-debugger #5 Tainted: G           OE
[  121.500882] --------------------------------------------
[  121.501969] insmod/2139 is trying to acquire lock:
[  121.502785] ffffffffc0830018 (slay){+.+.}-{2:2}, at: init_module+0x35/0x54 [sad]
[  121.504240]
[  121.504240] but task is already holding lock:
[  121.505167] ffffffffc0830018 (slay){+.+.}-{2:2}, at: init_module+0x1d/0x54 [sad]
[  121.506418]
[  121.506418] other info that might help us debug this:
[  121.507413]  Possible unsafe locking scenario:
[  121.507413]
[  121.508312]        CPU0
[  121.508700]        ----
[  121.509090]   lock(slay);
[  121.509619]   lock(slay);
[  121.510175]
[  121.510175]  *** DEADLOCK ***
[  121.510175]
[  121.511878]  May be due to missing lock nesting notation
[  121.511878]
[  121.513207] 1 lock held by insmod/2139:
[  121.513960]  #0: ffffffffc0830018 (slay){+.+.}-{2:2}, at: init_module+0x1d/0x54 [sad]
[  121.515413]
[  121.515413] stack backtrace:
[  121.516083] CPU: 2 PID: 2139 Comm: insmod Tainted: G           OE     5.10.158-debugger #5
[  121.517390] Hardware name: VMware, Inc. VMware Virtual Platform/440BX Desktop Reference Platform, BIOS 6.00 11/12/2020
[  121.518991] Call Trace:
[  121.519380]  dump_stack+0x8b/0xb0
[  121.519895]  __lock_acquire.cold+0xd5/0x2d2
[  121.520593]  lock_acquire+0xd3/0x2d0
[  121.521243]  ? init_module+0x35/0x54 [sad]
[  121.522032]  ? printk+0x58/0x73
[  121.522518]  _raw_spin_lock+0x2c/0x40
[  121.523084]  ? init_module+0x35/0x54 [sad]
[  121.523718]  ? 0xffffffffc082e000
[  121.524351]  init_module+0x35/0x54 [sad]
[  121.525003]  do_one_initcall+0x58/0x2d0
[  121.525598]  ? rcu_read_lock_sched_held+0x43/0x80
[  121.526317]  ? kmem_cache_alloc_trace+0x25b/0x2e0
[  121.527348]  do_init_module+0x4c/0x250
[  121.527995]  __do_sys_finit_module+0xb1/0x120
[  121.528661]  do_syscall_64+0x30/0x80
[  121.529217]  entry_SYSCALL_64_after_hwframe+0x61/0xc6
[  121.529984] RIP: 0033:0x7fad959ea2e9
[  121.530605] Code: 00 c3 66 2e 0f 1f 84 00 00 00 00 00 0f 1f 44 00 00 48 89 f8 48 89 f7 48 89 d6 48 89 ca 4d 89 c2 4d 89 c8 4c 8b 4c 24 08 0f 05 <48> 3d 01 f0 ff ff 73 01 c3 48 8b 0d 77 8b 0d 00 f7 d8 64 89 01 48
[  121.534301] RSP: 002b:00007ffdef995f38 EFLAGS: 00000246 ORIG_RAX: 0000000000000139
[  121.535891] RAX: ffffffffffffffda RBX: 0000564832d857c0 RCX: 00007fad959ea2e9
[  121.537305] RDX: 0000000000000000 RSI: 0000564830fc0260 RDI: 0000000000000003
[  121.538674] RBP: 0000000000000000 R08: 0000000000000000 R09: 00007fad95ac6960
[  121.540029] R10: 0000000000000003 R11: 0000000000000246 R12: 0000564830fc0260
[  121.541505] R13: 0000000000000000 R14: 0000564832d85760 R15: 0000000000000000
As we can see, the report provides a very detailed explanation of a deadlocking
scenario in our code. Specifically, it looks like our code tried to acquire the
slay lock while already holding it. As with the other examples, the report
additionally indicates instruction addresses of the offending lock acquires.
A quick peek at the code shows us that this is indeed what happened:
int sad_init(void)
{
	pr_info("this will be sad\n");

	spin_lock(&slay);
	pr_info("wow we have the lock\n");
	spin_lock(&slay);
	spin_unlock(&slay);
	spin_unlock(&slay);

	return 0;
}
To fix this, we would just have to delete the duplicate calls to spin_lock and
spin_unlock.
Example - Deadlock Warning
The above example is a very basic example of deadlock, but LOCKDEP also can
catch more obscure deadlock scenarios such as the one we have created in
jail.ko:
[   68.222910] wow we have the lock
[   68.226197]
[   68.226564] ================================
[   68.227498] WARNING: inconsistent lock state
[   68.227501] 5.10.158-debugger #5 Tainted: G           OE
[   68.227501] --------------------------------
[   68.227501] inconsistent {SOFTIRQ-ON-W} -> {IN-SOFTIRQ-W} usage.
[   68.227502] swapper/0/0 [HC0[0]:SC1[1]:HE1:SE0] takes:
[   68.227503] ffffffffc0a38078 (jae_L){+.?.}-{2:2}, at: timed_jail+0x11/0x30 [jail]
[   68.227514] {SOFTIRQ-ON-W} state was registered at:
[   68.227530]   lock_acquire+0xd3/0x2d0
[   68.227533]   _raw_spin_lock+0x2c/0x40
[   68.227534]   jail_init+0x24/0x43 [jail]
[   68.227536]   do_one_initcall+0x58/0x2d0
[   68.227538]   do_init_module+0x4c/0x250
[   68.227555]   __do_sys_finit_module+0xb1/0x120
[   68.227557]   do_syscall_64+0x30/0x80
[   68.227558]   entry_SYSCALL_64_after_hwframe+0x61/0xc6
[   68.227558] irq event stamp: 259324
[   68.227559] hardirqs last  enabled at (259324): [<ffffffffabb970a4>] _raw_spin_unlock_irq+0x24/0x40
[   68.227560] hardirqs last disabled at (259323): [<ffffffffabb97271>] _raw_spin_lock_irq+0x51/0x60
[   68.227562] softirqs last  enabled at (259320): [<ffffffffab2993d1>] irq_enter_rcu+0x71/0x80
[   68.227562] softirqs last disabled at (259321): [<ffffffffabc0112f>] asm_call_irq_on_stack+0xf/0x20
[   68.227563]
[   68.227563] other info that might help us debug this:
[   68.227563]  Possible unsafe locking scenario:
[   68.227563]
[   68.227563]        CPU0
[   68.227563]        ----
[   68.227564]   lock(jae_L);
[   68.227564]   <Interrupt>
[   68.227565]     lock(jae_L);
[   68.227565]
[   68.227565]  *** DEADLOCK ***
[   68.227565]
[   68.227566] 1 lock held by swapper/0/0:
[   68.227566]  #0: ffff995480003ea8 (/home/andyc/OS-dev/dev-guides/docs/files/debugging-examples/lock-interrupt/jail.c:18){+.-.}-{0:0}, at: call_timer_fn+0x5/0x290
[   68.227569]
[   68.227569] stack backtrace:
[   68.227570] CPU: 0 PID: 0 Comm: swapper/0 Tainted: G           OE     5.10.158-debugger #5
[   68.227571] Hardware name: VMware, Inc. VMware Virtual Platform/440BX Desktop Reference Platform, BIOS 6.00 11/12/2020
[   68.227572] Call Trace:
[   68.227574]  <IRQ>
[   68.227578]  dump_stack+0x8b/0xb0
[   68.227581]  mark_lock.cold+0x94/0xe9
[   68.227583]  ? mark_lock+0x43b/0x880
[   68.261466]  __lock_acquire+0x856/0x20e0
[   68.261469]  lock_acquire+0xd3/0x2d0
[   68.261472]  ? timed_jail+0x11/0x30 [jail]
[   68.261474]  ? 0xffffffffc0a36000
[   68.261475]  ? 0xffffffffc0a36000
[   68.261477]  _raw_spin_lock+0x2c/0x40
[   68.261478]  ? timed_jail+0x11/0x30 [jail]
[   68.261479]  timed_jail+0x11/0x30 [jail]
[   68.261482]  call_timer_fn+0xa2/0x290
[   68.261483]  __run_timers.part.0+0x1ed/0x2d0
[   68.261485]  ? ktime_get+0x62/0x140
[   68.261486]  ? ktime_get+0x98/0x140
[   68.261488]  ? lapic_next_event+0x1a/0x30
[   68.261489]  run_timer_softirq+0x26/0x50
[   68.261491]  __do_softirq+0xcd/0x47b
[   68.261492]  asm_call_irq_on_stack+0xf/0x20
[   68.261494]  </IRQ>
[   68.261496]  do_softirq_own_stack+0x5b/0x70
[   68.261498]  irq_exit_rcu+0xb1/0xf0
[   68.261500]  sysvec_apic_timer_interrupt+0x43/0xa0
[   68.261502]  asm_sysvec_apic_timer_interrupt+0x12/0x20
[   68.261503] RIP: 0010:native_safe_halt+0xe/0x20
[   68.261505] Code: 00 f0 80 48 02 20 48 8b 00 a8 08 75 c0 e9 77 ff ff ff cc cc cc cc cc cc cc cc cc cc e9 07 00 00 00 0f 00 2d c6 3e 47 00 fb f4 <c3> cc cc cc cc 66 66 2e 0f 1f 84 00 00 00 00 00 66 90 e9 07 00 00
[   68.261506] RSP: 0018:ffffffffac803e48 EFLAGS: 00000206
[   68.261507] RAX: 0000000000000006 RBX: 0000000000000001 RCX: 0000000000000000
[   68.261507] RDX: 0000000000000000 RSI: 0000000000000000 RDI: ffffffffabb964df
[   68.261508] RBP: ffff8d9f784dfc64 R08: 0000000000000001 R09: 0000000000000001
[   68.261508] R10: 0000000000000001 R11: 00000000000000c6 R12: 0000000000000001
[   68.261508] R13: ffffffffaca47a20 R14: 0000000000000001 R15: 0000000000000000
[   68.261510]  ? acpi_safe_halt+0x1f/0x50
[   68.261512]  acpi_safe_halt+0x24/0x50
[   68.261513]  acpi_idle_enter+0xde/0x120
[   68.261516]  cpuidle_enter_state+0x9d/0x470
[   68.261518]  cpuidle_enter+0x29/0x40
[   68.261519]  do_idle+0x20e/0x2d0
[   68.261521]  cpu_startup_entry+0x19/0x20
[   68.261524]  start_kernel+0x5a9/0x5ce
[   68.261527]  secondary_startup_64_no_verify+0xb0/0xbb
[   68.261568] I'm the interrupt I have the lock
If you’re following along with the examples, you likely will have no problem installing this module without a deadlock. This doesn’t necessarily mean that the module is deadlock-free, though.
As you will see from the above report, LOCKDEP has found a possible
deadlocking scenario in our code. Let’s look at the code:
void timed_jail(struct timer_list *in)
{
	spin_lock(&jae_L);
	pr_info("I'm the interrupt I have the lock\n");
	spin_unlock(&jae_L);
}

int jail_init(void)
{
	/* Make a timer that is set to expire immediately */
	mod_timer(&timer, jiffies);

	spin_lock(&jae_L);
	pr_info("wow we have the lock\n");
	spin_unlock(&jae_L);

	return 0;
}
As the report explains, there’s a possible deadlock with the lock jae_L.
Here’s the situation: let’s say we grab jae_L inside jail_init, but then the
timer created by mod_timer goes off and immediately starts running
timed_jail. timed_jail would then try to grab the jae_L lock, even though
jail_init has not yet unlocked jae_L. This is a deadlock, and it is exactly
the scenario described in the LOCKDEP report:
[   68.227563]  Possible unsafe locking scenario:
[   68.227563]
[   68.227563]        CPU0
[   68.227563]        ----
[   68.227564]   lock(jae_L);
[   68.227564]   <Interrupt>
[   68.227565]     lock(jae_L);
[   68.227565]
[   68.227565]  *** DEADLOCK ***
addr2line
When looking at a kernel stack trace, you will most likely be given an
instruction address in the form of <function>+<offset>. While this format
can be helpful to get a general idea of where in a function a specific error is
occurring, there are tools that can also tell us what line of code corresponds
to a given instruction.
For module code, we use the addr2line command like so:
$ cd <path/to/module>
$ addr2line -e <module>.o <function>+<offset>
Notice how we use addr2line on the .o file instead of the .ko file of
the module.
If you wish to find the line of an instruction found somewhere inside the
kernel, we can use the faddr2line script that Linux provides:
$ cd <path/to/linux>
$ scripts/faddr2line vmlinux <function>+<offset>
Alternative Method - addr2line’s output is not always perfectly accurate.
If addr2line is resulting in nonsensical outputs, you can also use gdb to
quickly find the line associated with a instruction address. First, load the
relevant source file:
$ cd <path/to/module>
$ gdb <module>.o
Then in the gdb command line, utilize the l command like so:
(gdb) l *(<function>+<offset>)
This will print out about 10 lines from the relevant source file and the exact
line corresponding to the offending address. You may additionally use gdb for
addresses inside the Linux kernel like so:
$ cd <path/to/linux>
$ gdb vmlinux
ftrace
The kernel provides a helpful debugging feature known as tracing. The idea is
simple - when an event occurs, record it. The kernel has many different tracers,
and one of the most helpful is ftrace. ftrace allows for all kernel function
calls to be logged, giving a detailed view of what is occuring inside the
kernel.
You can use ftrace to trace specific kernel functions or to trace the entire
kernel. We’ll begin with some basic setup and commands, and then show examples
of how ftrace can be used. Note that ftrace requires a few kernel config
options listed at the beginning of this guide.
ftrace exposes the “tracefs” filesystem to userspace. It is located in
/sys/kernel/debug/tracing, and to change tracing settings you modify files
located in this directory.
ftrace itself has different tracers to keep track of different features of a
function call, such as its parameters or the call stack. The tracers need to be
enabled within the kernel; several are by default, but not all of them. The ones
that are already enabled can be viewed like so:
# cat /sys/kernel/debug/tracing/available_tracers
hwlat blk mmiotrace function_graph wakeup_dl wakeup_rt wakeup function nop
The nop (no-op) tracer disables tracing entirely. The most useful tracer is
function_graph, which shows functions like a call graph. To select a tracer,
write it to the current_tracer file. For example, to choose function_graph
tracer:
# echo function_graph > /sys/kernel/debug/tracing/current_tracer
To enable tracing, write 1 to tracing_on:
# echo 1 > /sys/kernel/debug/tracing/tracing_on
When you want disable tracing, write 0 to the same file.
After enabling, view the trace output in trace:
# cat /sys/kernel/debug/tracing/trace | head -n 20
# tracer: function_graph
#
# CPU  DURATION                  FUNCTION CALLS
# |     |   |                     |   |   |   |
 0)               |                __sysvec_apic_timer_interrupt() {
 0)               |                  hrtimer_interrupt() {
 0)   0.361 us    |                    _raw_spin_lock_irqsave();
 0)   0.369 us    |                    ktime_get_update_offsets_now();
 0)               |                    __hrtimer_run_queues() {
 0)   0.366 us    |                      __remove_hrtimer();
 0)   0.315 us    |                      _raw_spin_unlock_irqrestore();
 0)               |                      tick_sched_timer() {
 0)   0.720 us    |                        ktime_get();
 0)   0.315 us    |                        tick_sched_do_timer();
 0)               |                        tick_sched_handle() {
 0)               |                          update_process_times() {
 0)   0.402 us    |                            account_process_tick();
 0)   0.276 us    |                            hrtimer_run_queues();
 0)               |                            raise_softirq() {
 0)   0.285 us    |                              __raise_softirq_irqoff();
Let’s try it out with something simple:
# cd /sys/kernel/debug/tracing
# cat tracing_on                                       # ensure tracing is off
0
# echo function_graph > current_tracer                 # set tracer to function_graph
# echo > trace                                         # clear the trace file
# echo 1 > tracing_on ; sleep 1; echo 0 > tracing_on   # run tracing for a second
# wc -l trace                                          # let's see how big this file is...
41800 trace
Each line in the trace file is a new function call, so this means in 1 second
the kernel made at least 40,000 function calls. It likely made even more,
because the ftrace buffer has a buffer size set in buffer_size_kb. Clearly,
if we’re going to do anything useful with this tracing information, we need to
filter traces.
Let’s make our lives easier by introducing the trace-cmd command-line tool.
Compared to interacting with tracefs, trace-cmd provides an easier way to
interact with ftrace. You’ll need to install it like so:
# apt install trace-cmd
It also has better documentation than tracefs – see man trace-cmd. Note that
you’ll always have to run trace-cmd with sudo.
Let’s try to do something similar to the above with trace-cmd:
# trace-cmd reset                                   # reset ftrace
# trace-cmd record -p function_graph -F sleep 1     # trace 'sleep 1'
  plugin 'function_graph'
CPU0 data recorded at offset=0x209000
    0 bytes in size
CPU1 data recorded at offset=0x209000
    0 bytes in size
CPU2 data recorded at offset=0x209000
    0 bytes in size
CPU3 data recorded at offset=0x209000
    1585152 bytes in size
The -p flag of record specifies the type of tracer, while the -F flag
specifies the command that will be run. In place of -F, you can specify the
PID of a process with -P. See man trace-cmd-record for all options.
# trace-cmd report -l > sleep1.txt                  # output the report
# wc -l sleep1.txt
31027 sleep1.txt
trace-cmd can also be useful to filter certain function calls. In this
example, the -g flag specifies that only function calls that contain _rt are
traced. If the PID specified were a realtime task, it would trace all
function calls in the real-time scheduler. The -m flag specifies a maximum
buffer size.
# trace-cmd record -p function_graph -g *_rt* -m 100 -P [PID]
The kernel provides static trace points for certain event classes rather than all function calls. They are grouped by subsystems of the kernel, such as the scheduler or syscalls. We can list all of the available types of events like so:
# trace-cmd list -e
This will output a huge list of all available events. To see the main classes of
events you can trace, inspect the events directory:
# ls /sys/kernel/debug/tracing/events
The most relevant classes of events for our purposes are syscalls, sched,
and task, but you may find others useful.
To trace a specific event, use the -e flag. Here we trace all the events of
the syscalls and sched classes in sleep 1.
# trace-cmd reset
# trace-cmd record -e syscalls -e sched -F sleep 1
<snip>
# trace-cmd report -l > sleep1_new.txt
The output is still large, but is more managable than before. We can view the important scheduling work here:
   sleep-1766    2d... 23009.861810: sched_stat_runtime:   comm=sleep pid=1766 runtime=944000 [ns] vruntime=1666934030 [ns]
   sleep-1766    2d... 23009.861814: sched_switch:         sleep:1766 [120] S ==> swapper/2:0 [120]
  <idle>-0       2d.h. 23010.863085: sched_waking:         comm=sleep pid=1766 prio=120 target_cpu=002
  <idle>-0       2dNh. 23010.863125: sched_wakeup:         sleep:1766 [120] success=1 CPU:002
Unfortunately, this only gives us a general idea of what’s happening rather than
the actual function calls. We can pass the -T flag to trace the call stack at
each tracepoint.
# trace-cmd record -T -e syscalls -e sched -F sleep 1
# trace-cmd report -l > sleep1_all.txt
$ grep -B 20 sched_switch sleep1_all.txt
=> __traceiter_sched_stat_runtime (ffff8000101cb4c4)
=> update_curr (ffff8000101e0830)
=> dequeue_entity (ffff8000101e0f80)
=> dequeue_task_fair (ffff8000101e25f8)
=> dequeue_task (ffff8000101d0f44)
=> __schedule (ffff800010c08240)
=> schedule (ffff800010c08504)
=> do_nanosleep (ffff800010c0c9f8)
=> hrtimer_nanosleep (ffff80001024d250)
=> common_nsleep (ffff80001025562c)
=> __arm64_sys_clock_nanosleep (ffff800010256704)
=> el0_svc_common (ffff80001012a294)
=> do_el0_svc (ffff80001012a420)
=> el0_svc (ffff800010c013f0)
=> el0_sync_handler (ffff800010c01970)
=> el0_sync (ffff800010111f00)
   sleep-1878    0d... 24257.936236: sched_switch:         sleep:1878 [120] S ==> swapper/0:0 [120]
There is much to explore in the trace-cmd utility. Some useful options:
hist- creates a histogram of events.stack- a kernel stack tracer, outside the scope of this guide.restore- restore trace data of a crashed run.
Another way to add more information to your traces is with trace_printk(). The
syntax of trace_printk is similar to printk(), and can be used to output to
the trace log rather than the kernel log buffer. trace_printk is much faster
than the traditional printk, allowing it to be called more frequently without
significantly slowing down the system. It can be useful to give context to your
traces and set points to search for in a large trace.
Viewing the trace of an OOPS
One of the most useful applications of ftrace is to see which function call
triggered an OOPS or kernel panic. However, it requires some extra configuration
to get this information.
Enable traceoff_on_warning and ftrace_dump_on_oops:
# sysctl kernel.traceoff_on_warning=1
# sysctl kernel.ftrace_dump_on_oops=2    # 1 == all CPUs, 2 == most recent CPU
Since only the most recent trace data is relevant, the buffer size can be reduced:
# echo 10 > /sys/kernel/debug/tracing/buffer_size_kb
To demonstrate, we’ll use a simple kernel module that throws an oops because of a double free:
int init(void)
{
    char *s;
    s = kmalloc(100, GFP_KERNEL);
    kfree(s);
    kfree(s);
}
We’ll set up tracing:
# cd /sys/kernel/debug/tracing
# echo function_graph > current_tracer
# echo 1 > tracing_on
# cd <module dir>
# sudo insmod double_free.ko
Message from syslogd@jerdeb at Mar 24 20:34:10 ...
 kernel:[  221.382539] Internal error: Oops - BUG: 0 [#1] SMP

Message from syslogd@jerdeb at Mar 24 20:34:10 ...
 kernel:[  221.384563] Code: ca000042 ca030042 f8246822 d65f03c0 (d4210000)
We can then view the end of our trace file:
# tail trace
 2)   0.583 us    |                kfree();
 2)               |                kfree() {
 2)               |                  do_debug_exception() {
 2)               |                    brk_handler() {
 2)               |                      call_break_hook() {
 2)               |                        bug_handler() {
 2)   0.125 us    |                          is_valid_bugaddr();
 2)               |                          /* Disabling tracing due to warning */
We can clearly see that the second kfree() throws a debug exception. A number
of methods could be used to debug further, such as using trace_printk() to see
what is passed into kfree(), or using the function tracer to see the input
arguments to kfree().
Viewing the trace of a kernel panic
The above method only works with OOPS that do not crash the kernel. It is often more useful to view a trace from a crashed kernel.
ftrace_dump_on_oops will insert the trace into the kernel ring buffer on
panic. It can be set while the kernel is running like so:
# sysctl kernel.ftrace_dump_on_oops=1
In cases where the kernel does not boot, it’s necessary to set
ftrace_dump_on_oops as a kernel command line argument. You can do this while
also setting up the serial console.
At boot time, navigate to Advanced Options for GNU/Linux. Press e on the
kernel you are booting into, and append this to the same line you append the
serial console to:
ftrace=function ftrace_dump_on_oops trace_buf_size=10K
These settings are configurable. For example, you could use the function_graph
tracer rather than function. You can also configure the trace_buf_size, but
it is recommended to keep it small so that it doesn’t take long for the trace to
be sent through the serial console.
The final line may look something like this, with both serial console and
ftrace settings:
linux /boot/vmlinuz-<kernel> root=UUID=<uuid> ro console=ttyS0 ftrace=function ftrace_dump_on_oops trace_buf_size=10K
If your kernel crashes during boot, the trace will be written through the serial console. Note that this will boot the kernel with tracing enabled, so it may run slower than usual.
Using crash to view crashed traces
When the kernel crashes, a kernel crash dump file is created that stores
information about the state of the kernel. A large amount of information is
stored in the crash dump, most of which is outside the scope of this guide. We
will use the crash utility to extract the trace output from a crashed kernel.
Note that this is an advanced method, and may not work on Arm CPUs. It is often simpler and more reliable to write to the serial console.
We’ll first install crash and kdump-tools, along with dependencies:
# apt install kdump-tools crash makedumpfile
Answer yes to the pop-up questions. After installing, you’ll need to reboot
your VM. To confirm the crash dumps are set up, run sudo kdump-config show.
When the kernel crashes, it’ll output a core dump file to the
/var/crash/<time>/<time>.dump file. We can use crash to read this file
and extract the trace.
Finally, install the crash-trace extension to crash. On x86 systems, clone
this repository, and on Arm clone
this repository. Enter the repository
and run make.
After running make, there should be a trace.so file. Copy this file into the
crash extension directory:
# cp trace.so /usr/lib/crash/extensions/
At this point, all of our tooling is setup. We can test it out by crashing our kernel, generating a core dump and reading the trace from that dump.
# echo 1 > tracing_on
# echo c > /proc/sysrq-trigger     # immediately crashes the kernel
<crash!>
After rebooting:
$ ll /var/crash
drwxr-xr-x  2 root root 4096 Mar 24 22:34 202303242234/
$ cd 202303242234
$ ll
-rw------- 1 root root    60005 Mar 24 22:34 dmesg.202303242234
-rw-r--r-- 1 root root 68117055 Mar 24 22:34 dump.202303242234
crash requires two inputs: the dump file and the uncompressed Linux kernel
executable. This is the vmlinux executable generated by building Linux. Note
that this is different from the vmlinuz located in the /boot directory,
since that is the compressed executable.
Use the -x flag to load the trace extension:
# crash -x <path to linux src>/vmlinux /var/crash/<time>/dump.<time>
crash is a fully featured program to inspect a crash dump. Some commands that
might be helpful are bt, to get the backtrace, and foreach task to list all
task_structs.
To see the options that the trace extension to crash provides, run:
crash> help trace
To dump a trace to a file:
crash> trace dump -t <path>/trace.dat
crash> exit
You can then use trace-cmd to inspect the file as if it were any other
trace.dat file, for example:
# trace-cmd report <path>/trace.dat | tail -20
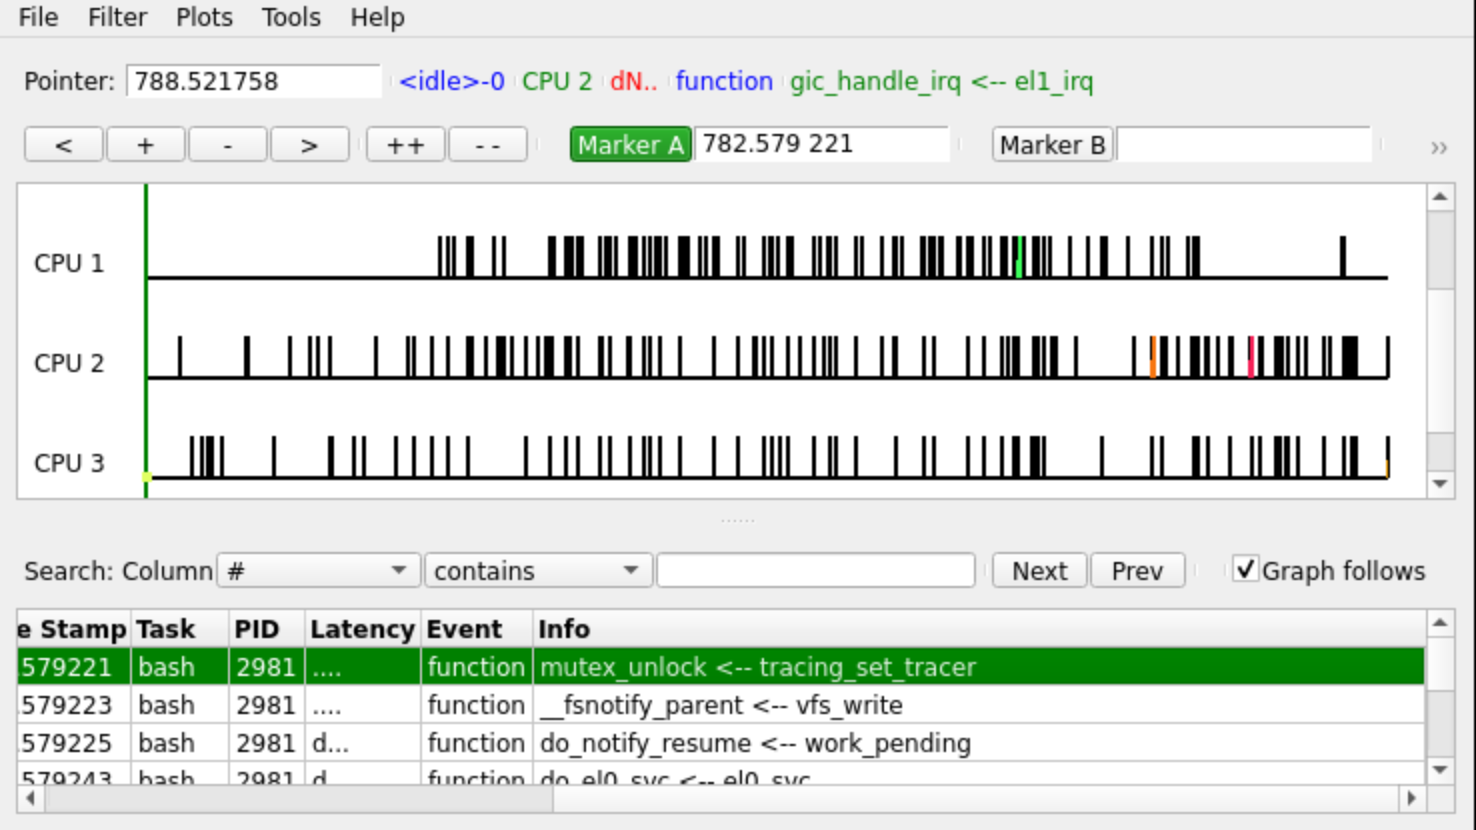
KernelShark
Sometimes the excessive text output of ftrace can be overwhelming, which is why
the creators of ftrace created a visual interface to read trace output.
KernelShark places a trace on a timeline so that the user can interactively step
through it.
To install KernelShark:
# apt install kernelshark
The trace-cmd utility creates trace.dat files which are read by KernelShark.
These files aren’t something inherent to ftrace itself, so if you’re using
tracefs it must be extracted from the kernel buffer:
# trace-cmd extract
$ kernelshark trace.dat
The GUI places a focus on the timing of traces and allows for easier filtering by CPU or PID: